

In many manufacturing companies, particularly smaller ones, it is often a source of great surprise when they are presented with the activity data for their machines. Too often, this data isn’t even recorded never mind thought about, yet it can provide significant and valuable insights about a company’s operations.
Capturing this data and using it to make decisions about production patterns and machine management is one of the lowest of the low hanging fruits in digital transformation.
The purpose of the OpenMachineMonitoring project is to help SME manufacturers reach this low hanging fruit by providing an open and accessible tool that they can adopt and use exactly how they wish with no commitment or vendor lock-in and full visibility and control over how the tool works.
That is the vision of OpenMachineMonitoring.
In terms of actual functionality, the core idea is to collect electricity consumption data (electrical current) from machines and track how long they spend within certain defined zones; a simple example would be above 1.5 A for “up” or “active”, below 0.5 A for “down” or “off”, and anything in between means an “idle” or “standby” state. These are arbitrary limits just to give an example.
Armed with this record of activity, a production manager could compare the data with what they believe should be happening (a production schedule or similar) and find potential savings (e.g. from a machine left switched on when it could be switched off) or identify spare capacity and so on.
In this post we will go on a high-level tour of the OpenMachineMonitoring tool.
Time for a Tour
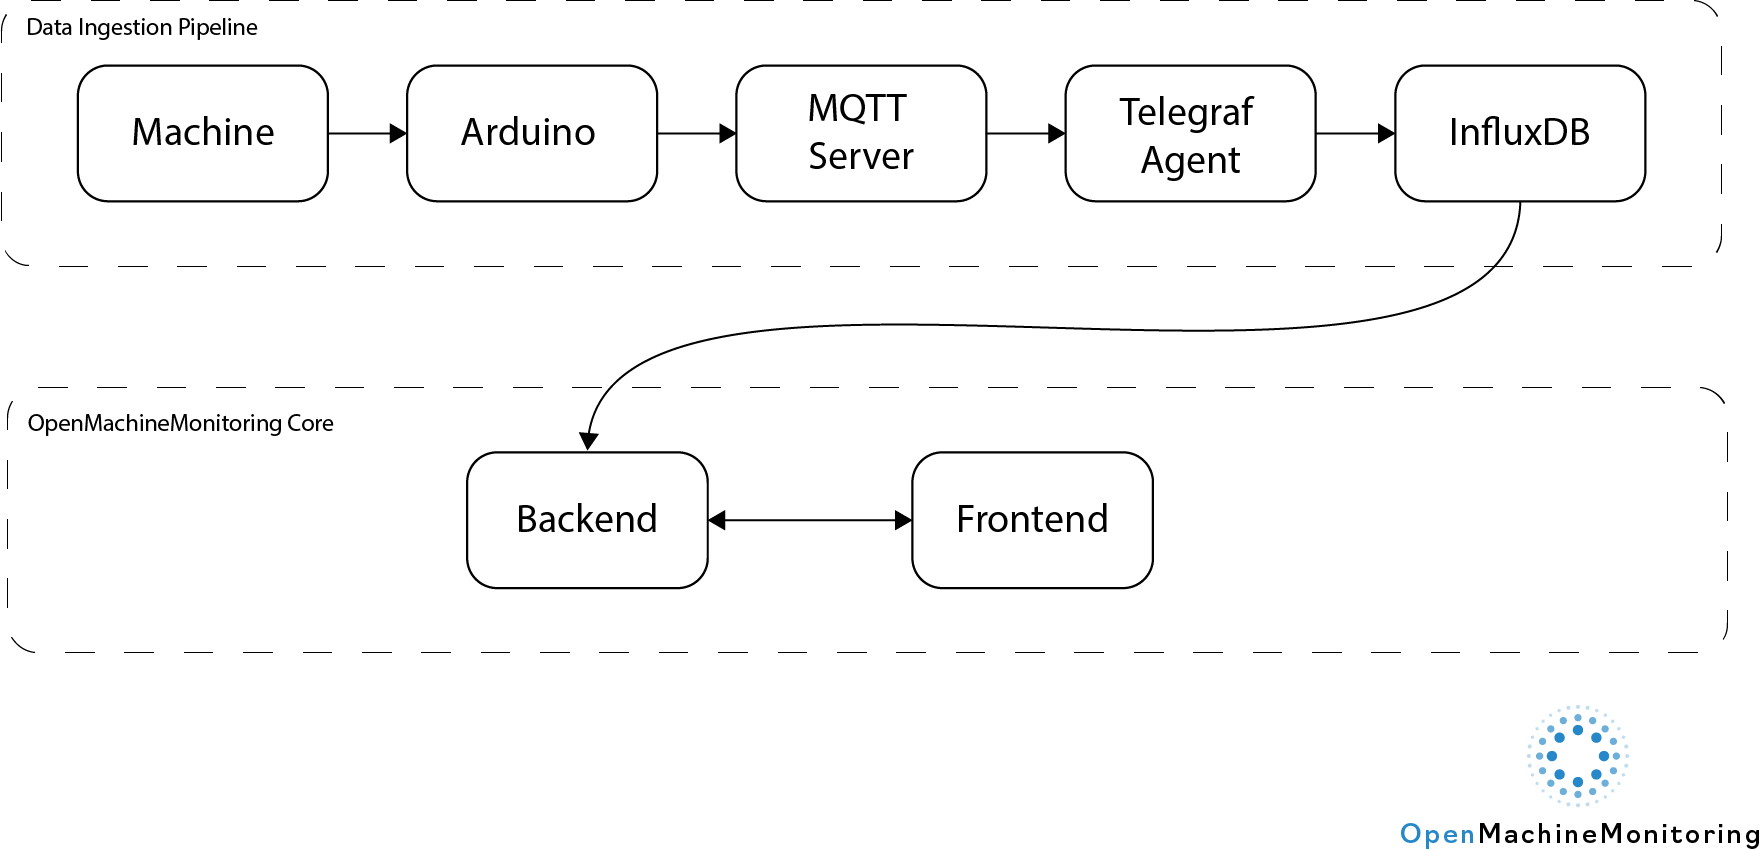
OpenMachineMonitoring is not one entity. It is a collection of components all working together to form the overall tool. Broadly, these components include:
A means of ingesting data and storing it in a database
A means of retrieving and processing the stored data
A means of displaying data and information to the user
The block diagram below gives a visual representation of how these components fit together.
Some of these blocks (e.g. the Arduino) are specific to my test rig which I will use as an example throughout this post. However, it’s important to remember that OpenMachineMonitoring is intended to be a flexible tool and the exact implementation details of my test rig could be adapted quite easily to better suit other use cases. For example, it would be easy to swap the Arduino with another data collection setup.
Hardware
Our tour begins at the hardware level with sensing electrical current from a machine and ingesting it into the tool.
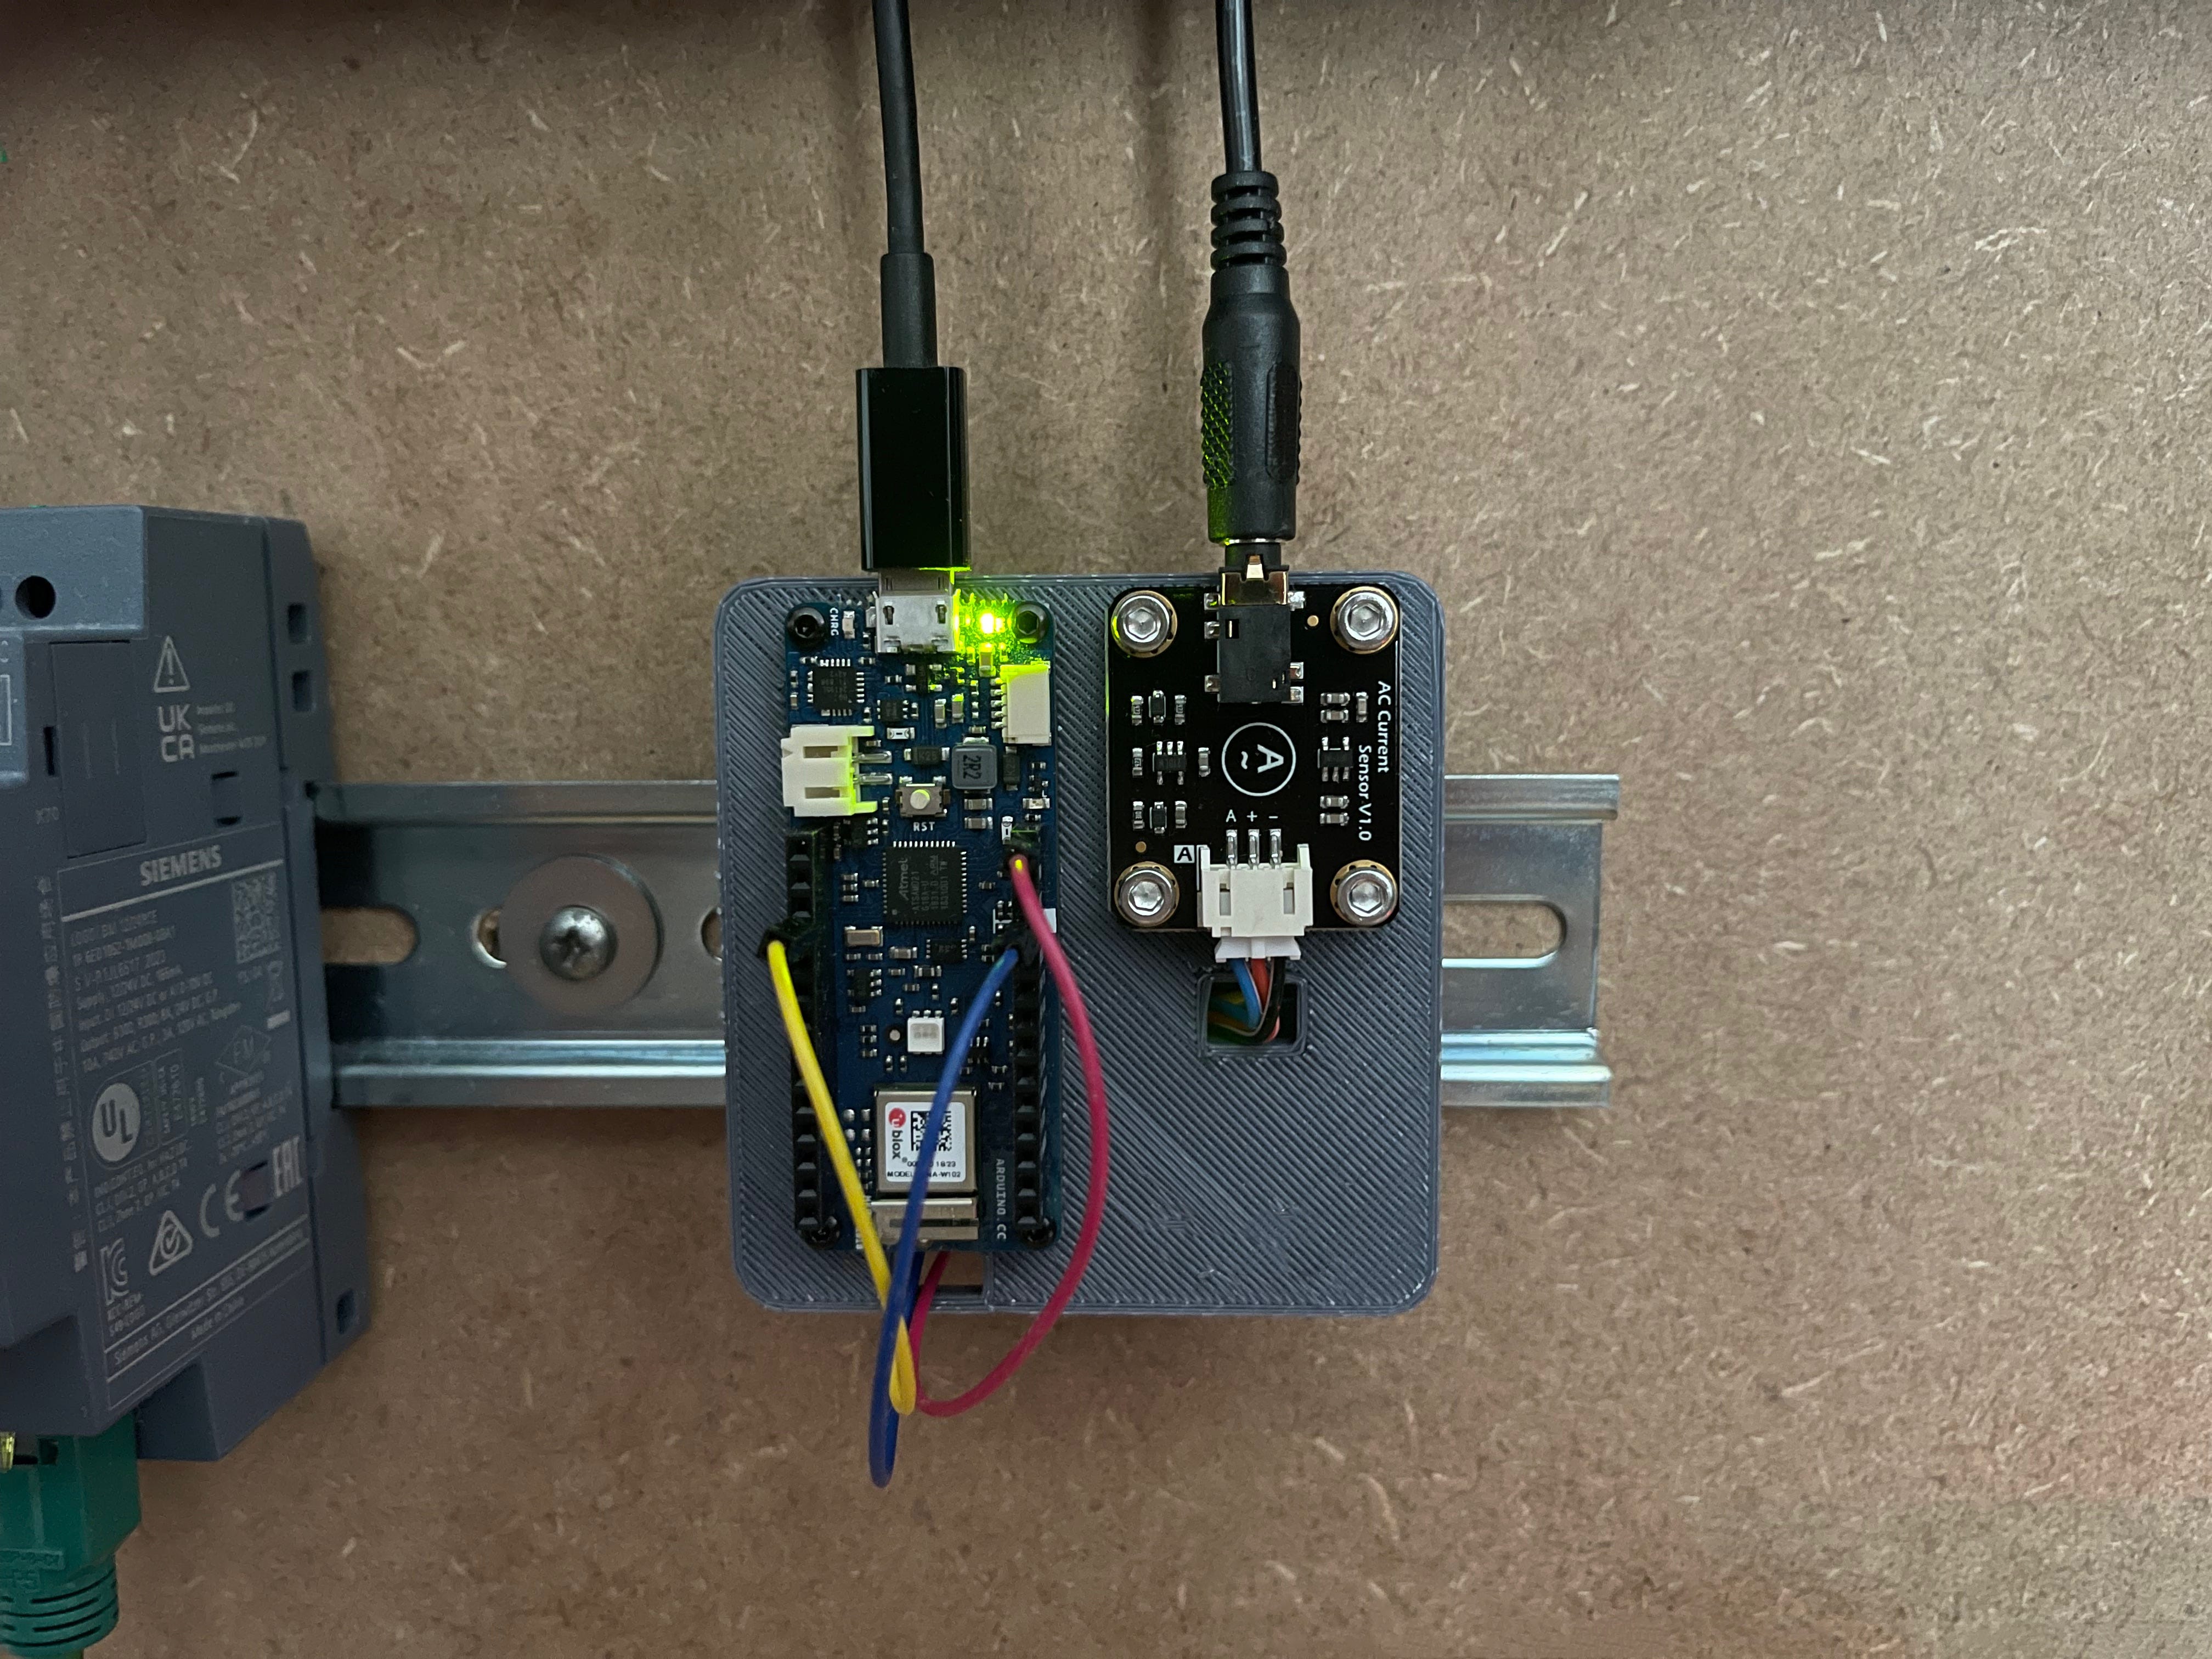
With OpenMachineMonitoring choice of sensing hardware is very much up to the user. Whether it’s a clip-on current sensor plugged into an Arduino board, or a more industrial DIN rail-mounted current meter wired up to a PLC, as long as the data is in a known format, OpenMachineMonitoring will be able to handle it.
For my test rig I have a YHDC current sensor (link) that clips around a single conductor cable. The sensor plugs into an Arduino via a signal conversion module (image below) and the data is put into JSON format ready for the data pipeline.
Data Pipeline
With the data packaged up correctly, the next stage is to transport it from the edge (the machine) to a cloud database for storage.
To do this OpenMachineMonitoring uses a HiveMQ MQTT server, a Telegraf agent and InfluxDB.
The MQTT protocol has established itself as a staple in IoT applications. It is lightweight, simple and very flexible; ideal characteristics for OpenMachineMonitoring. HiveMQ are one of the leading MQTT server providers who have a good free tier that will be fine for small-scale deployments.
It’s also perfectly possible to replace HiveMQ with a server from an alternative provider.
The Arduino I use in my test rig has internet connectivity (via WiFi) and so I am able to connect directly to the HiveMQ server and publish the data from the electrical current clamp sensor. The connection to the MQTT server, reading data from the sensor and the data preparation all happen automatically when the Arduino is powered up and continue at a defined rate.
You can find more detail of how to get the Arduino set up and publishing data to the HiveMQ broker in another post. It is a really useful prototyping setup for a wide range of applications, not just for OpenMachineMonitoring.
Providing the bridge between the HiveMQ MQTT server and the InfluxDB instance is a Telegraf agent. In my test rig, the agent runs on a Raspberry Pi (located near the Arduino). The Telegraf agent is configured through the InfluxDB UI to listen for data on certain topics on the HiveMQ server and forward them to InfluxDB.
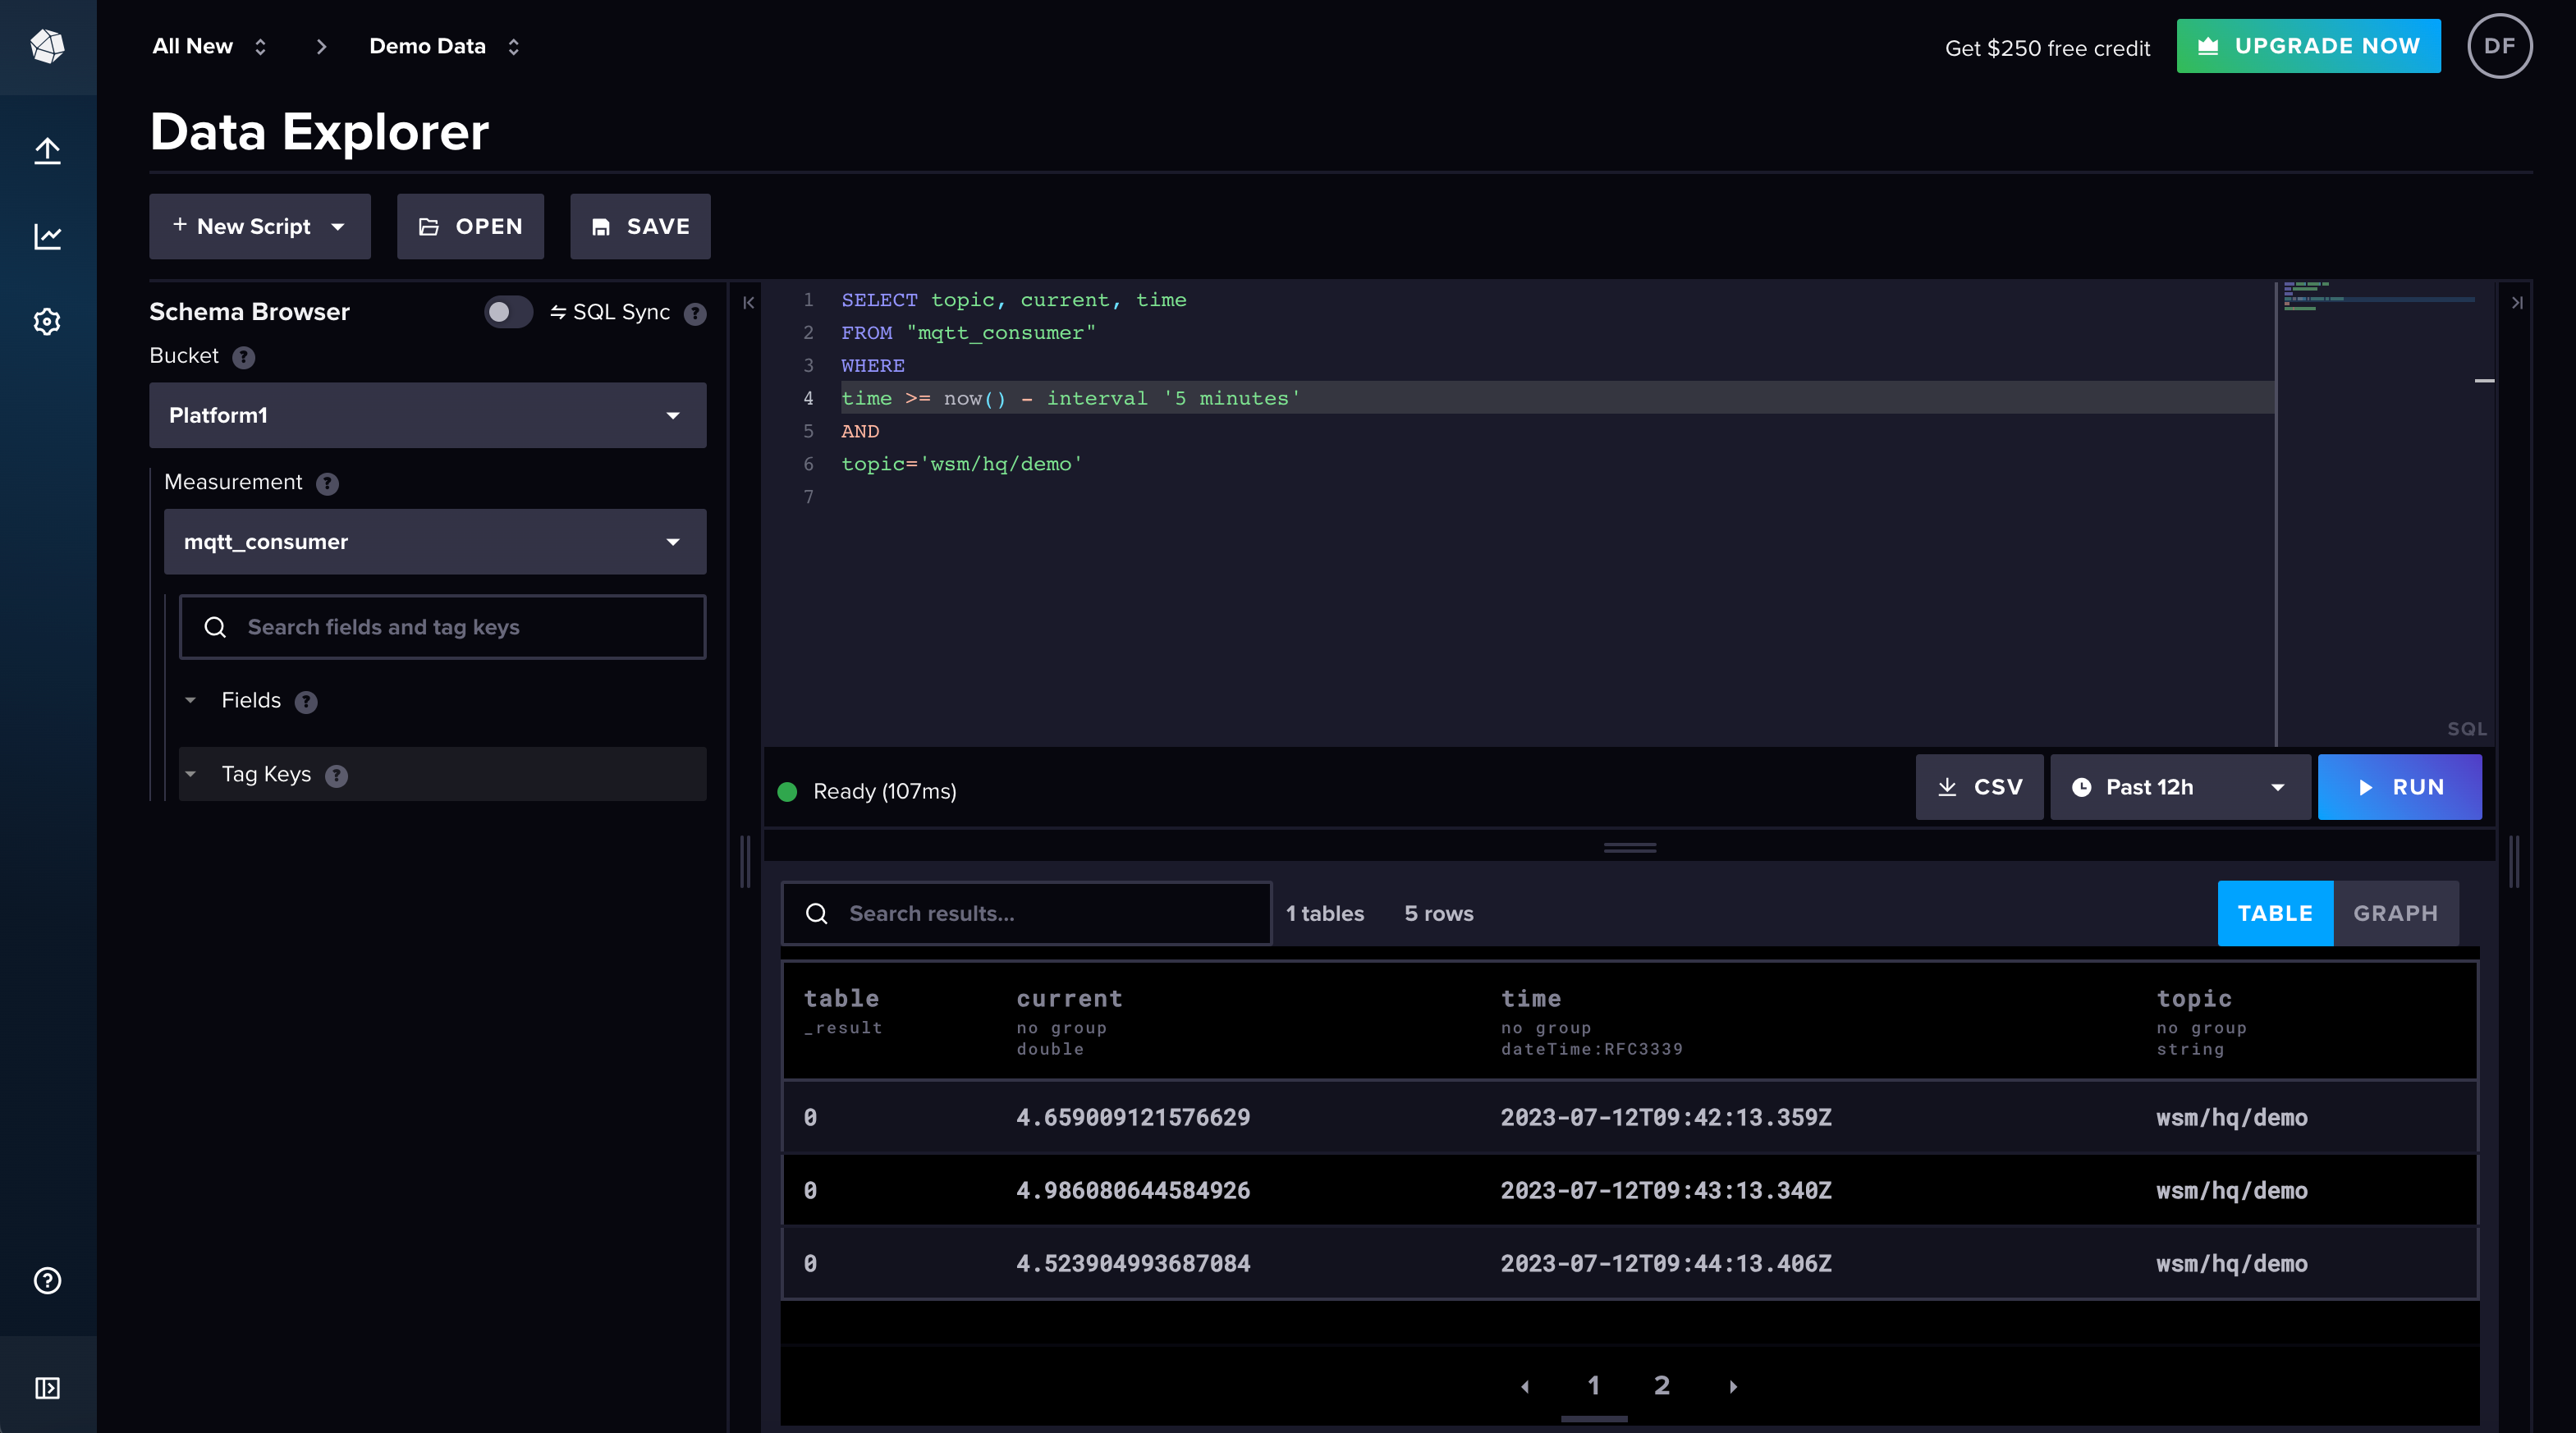
The beauty of this data ingestion pipeline is that it is decoupled from the OpenMachineMonitoring backend and frontend. As long as the cloud services are up and the Telegraf agent remains live, data will continue to be ingested.
Backend
The components covered so far have been largely off-the-shelf. Apart from the Arduino sketch for handling the data at the edge, there has been no custom code. That is about to change as we come to the substance of OpenMachineMonitoring: the backend and frontend. This is where the real value of the tool are found.
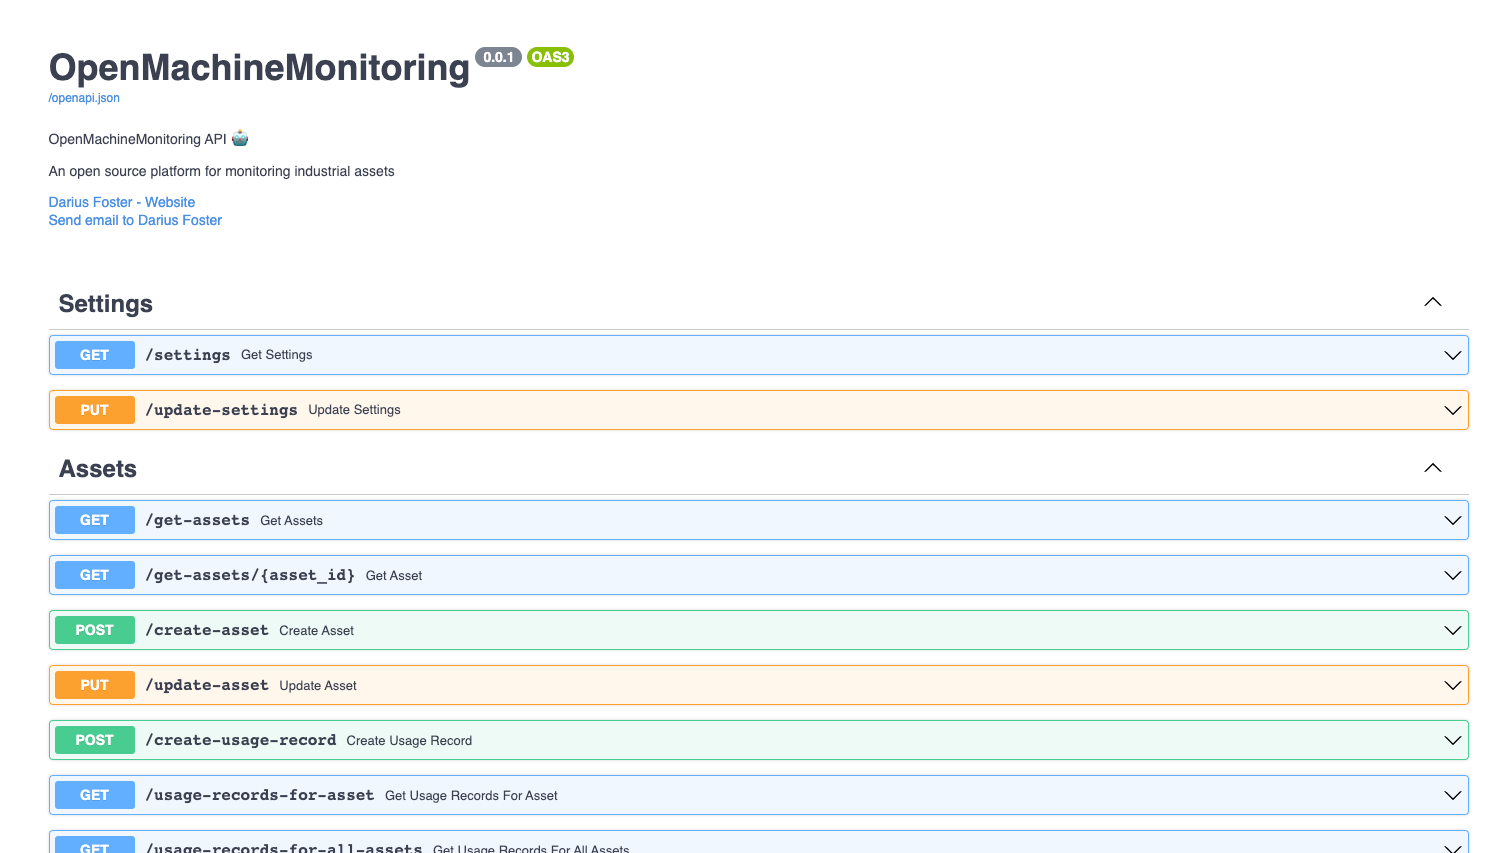
OpenMachineMonitoring’s backend is written in Python and uses the FastAPI framework to create an API with the following functionality:
Settings: Functions for retrieving and updating important settings (e.g. the day that marks the start of a week).
Data query: Functions to retrieve data from InfluxDB for given machines and over specified a time period.
Metric calculations: Functions for calculating activity metrics (e.g. uptime).
The backend uses a SQLite database to store calculated metrics and important settings. Using an SQLite database keeps things light and simple for the first version of OpenMachineMonitoring. However, as the tool grows alternative database options will be implemented to cope with more demanding deployment situations.
Other planned functionality for future versions include user profiles, access management, adding event information (e.g. production schedules and explanations for downtime), more complex data processing and an AI-driven assistant that will enhance usability of the tool.
Furthermore, as OpenMachineMonitoring is open source, there is nothing stopping users from tweaking existing functionality or even adding new functionality in the backend (e.g. adding new metric calculations to suit a given use case); there’s no need to wait for a third party to prioritise and develop features for you!
Frontend
For our last stop on this tour we come to the user interface.
An easily accessible and easy-to-use interface is critical if users are going to get value from the tool. Like similar products on the market, OpenMachineMonitoring is accessed through a web browser. This provides a familiar, commonly available interface and allows us to leverage well-established and capable libraries and tools.
To this end, the frontend is written in Typescript using React and Chakra UI elements.
The Recharts library provides data plotting functionality (line charts, bar charts etc.).
In its current state, the frontend has five main views: an asset view, a timeline view, a “this week” view, a calendar view and a ranked view.
As with the backend, thanks to being open source it is very possible to tweak the standard views or even add custom views to suit different purposes.
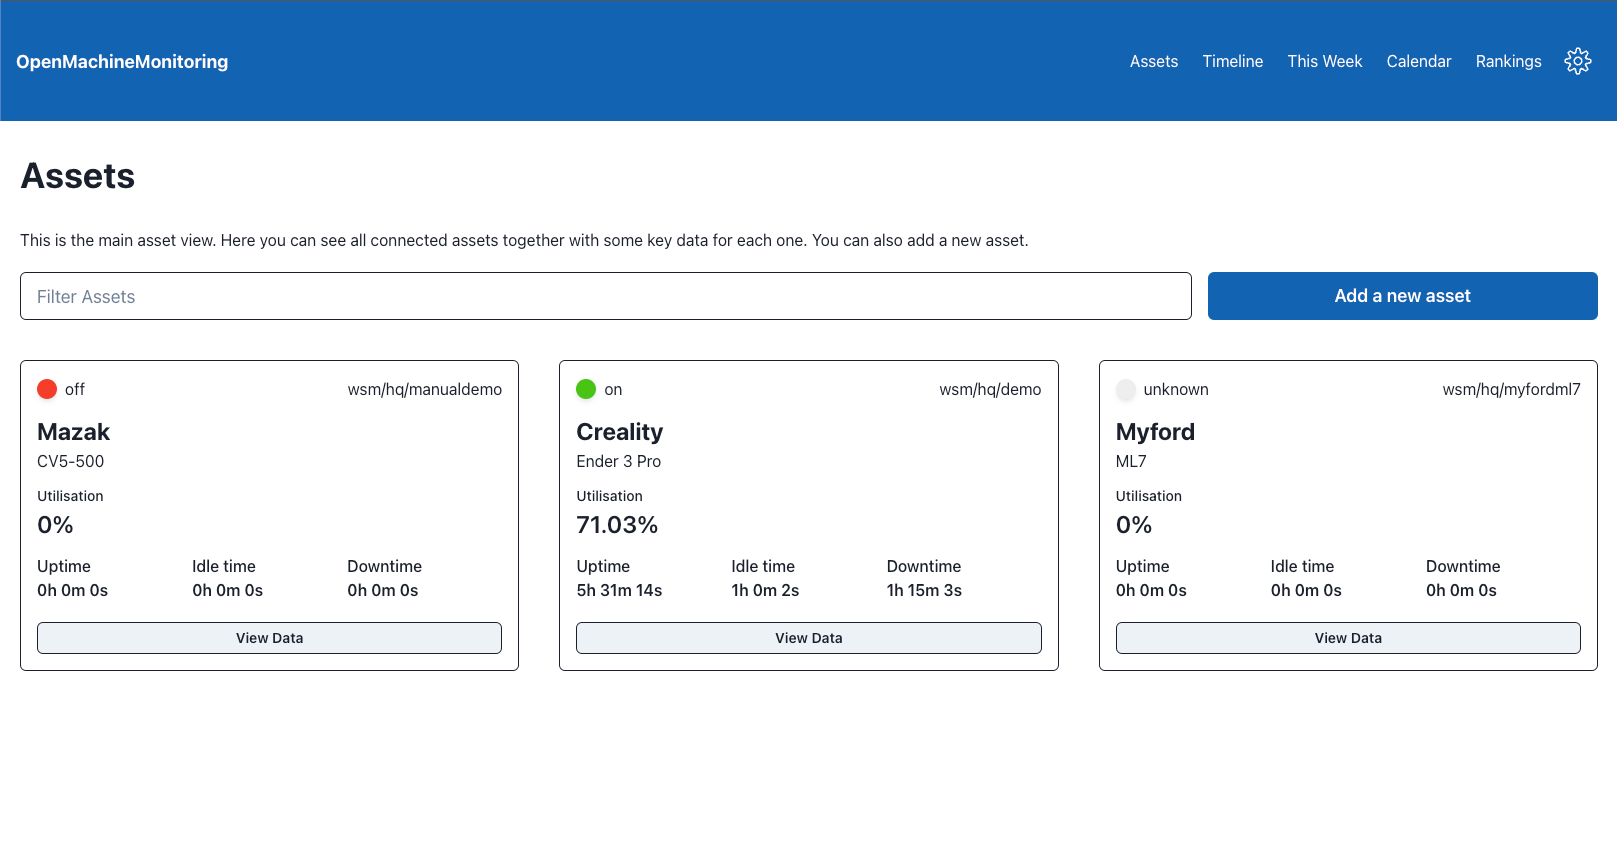
Asset View
The asset view shows all of the machines currently connected to OpenMachineMonitoring in a clear grid layout.
The view also contains the “add a new asset” button with which users can add a new asset connection to the tool by simply setting a name (manufacturer/model of the machine) and the MQTT topic the data is published on.
For each connected machine there is a card that shows important information including uptime percentages. At the moment, uptime is calculated on the frontend according to a simple formula:
More options for calculating activity metrics are in the pipeline (e.g. OEE).
Finally, there is also a button to open up a data view that shows how electrical current has varied over time.
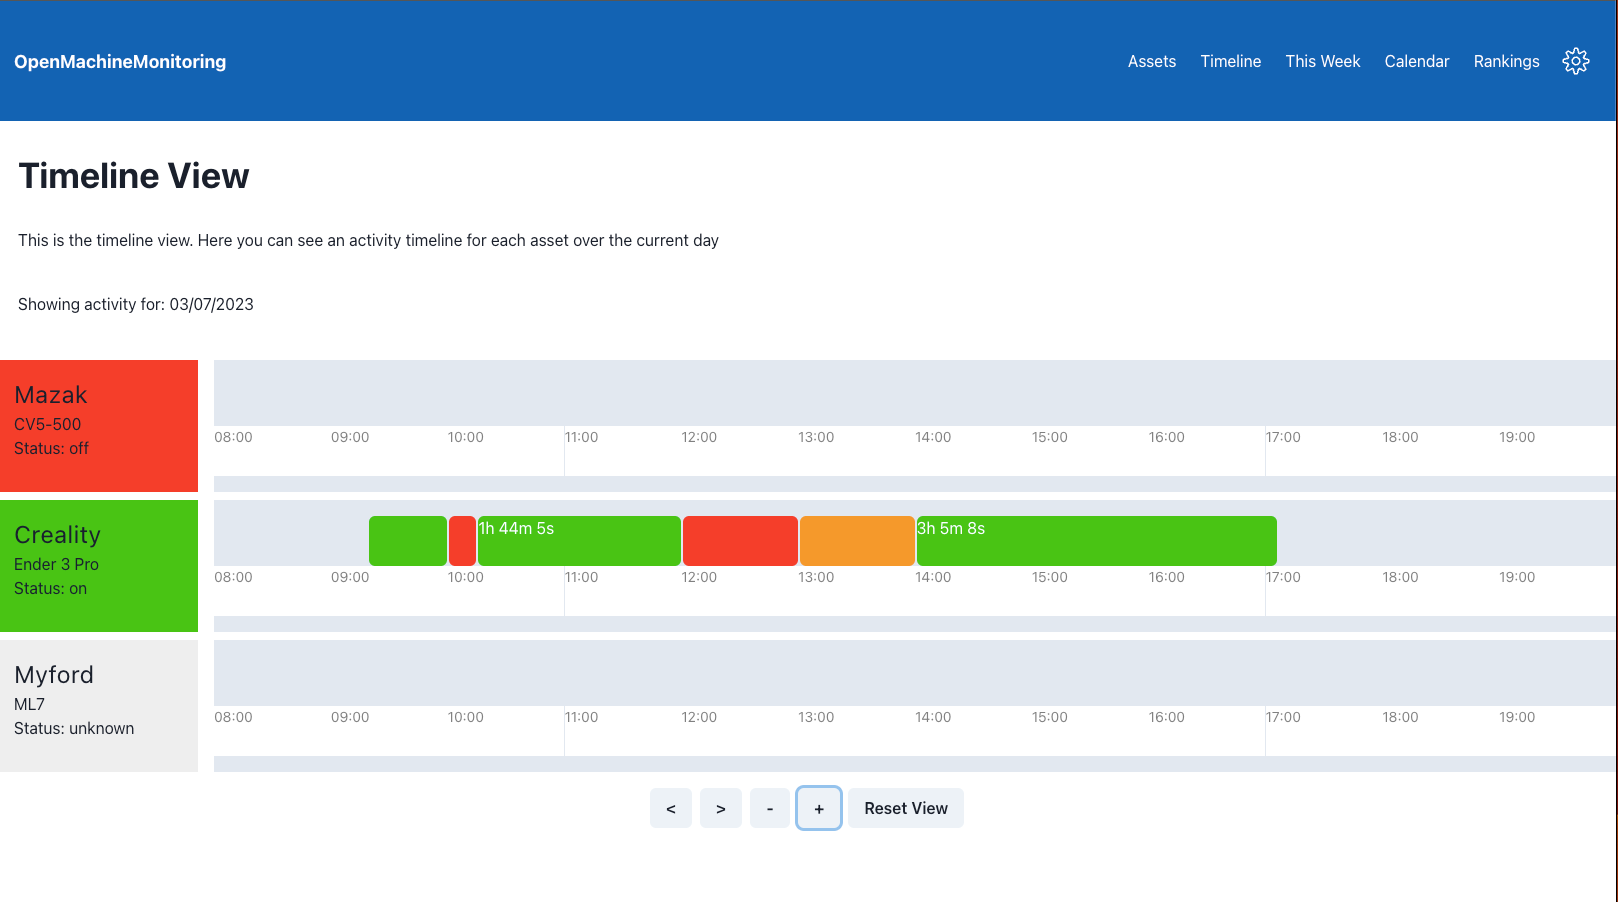
Timeline View
The timeline view shows different periods of activity over the current day. This allows a user to see usage patterns across their machines over that day.
In the current iteration a series of blocks define periods of “uptime”, “idle time” and “downtime” for each machine. The user can zoom in and pan across this timeline view.
When support for event information is released in a future version, the events will be shown on the timeline view as well. This will be useful to compare planned activity with actual activity right in the OpenMachineMonitoring interface itself and so inform decisions about how production could be improved.
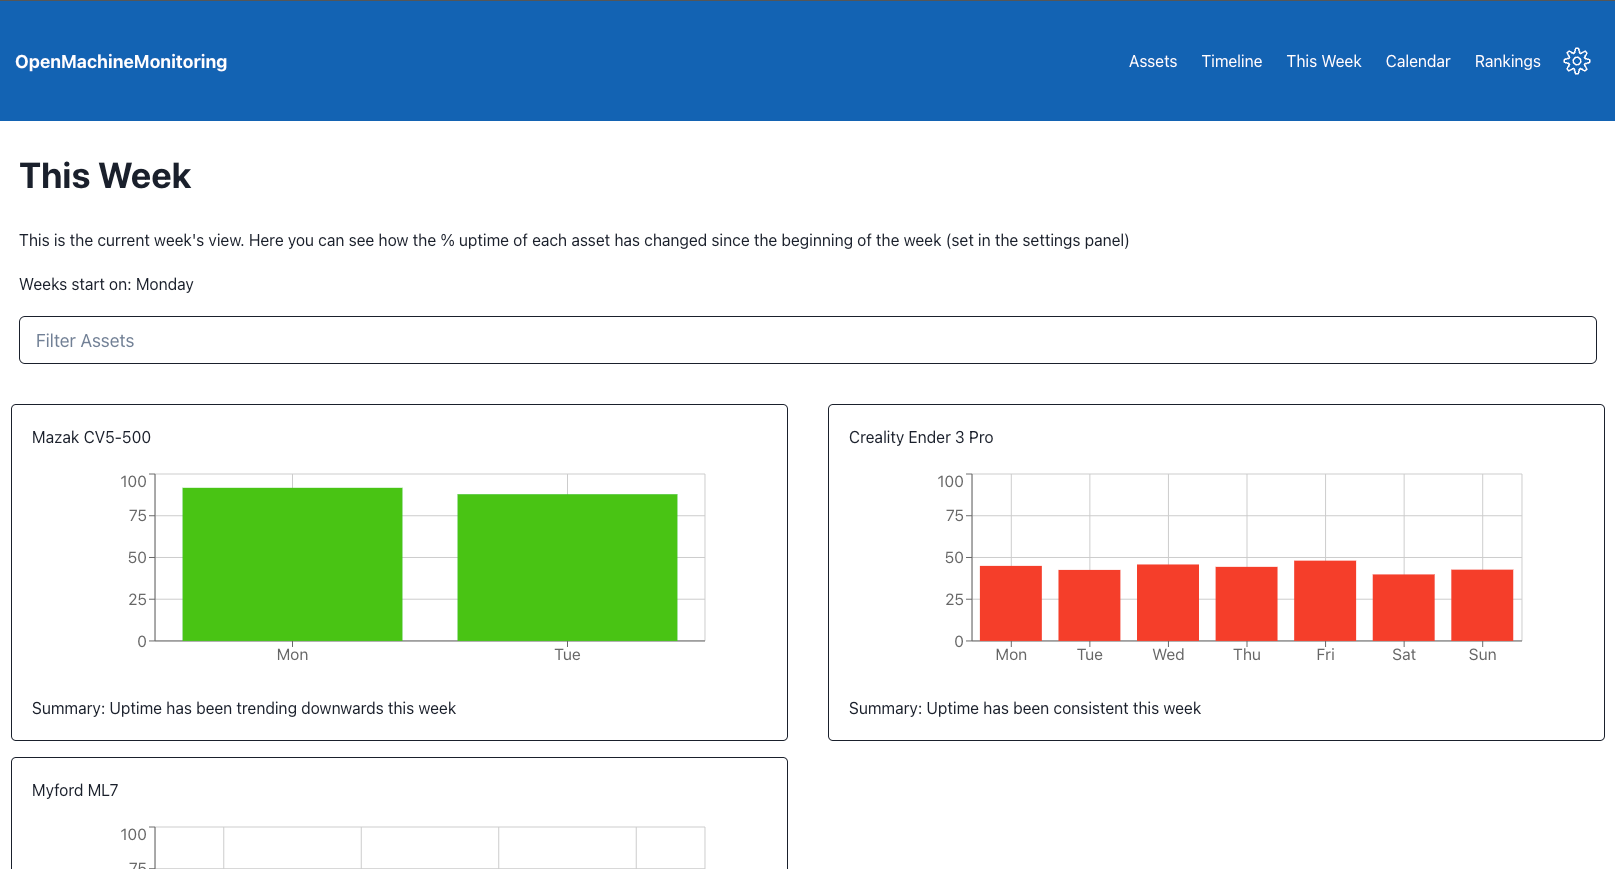
“This Week'“ View
The “this week” view shows bar chart plots for the daily activity of each machine over the current week.
At the moment, each bar chart shows the average uptime (time spent “on” as a proportion of total time measured) for each day. The view also informs the user about how uptime has changed over that week (i.e. trending upwards/downwards or remaining consistent) for each machine.
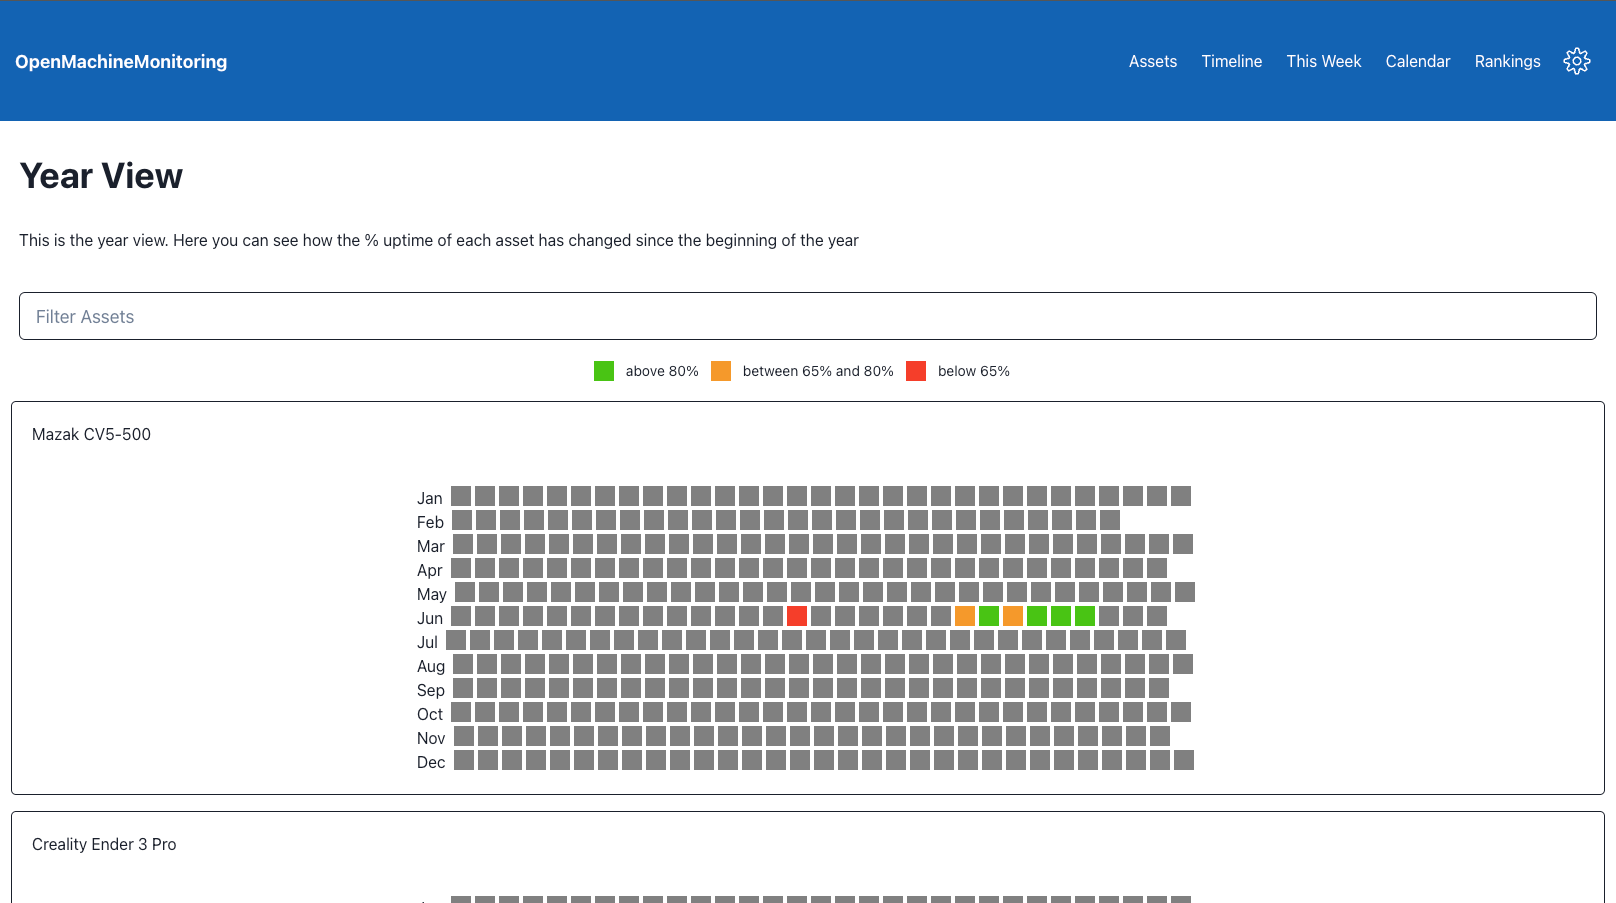
Calendar View
The calendar view represents each day in the current year with a box that changes colour based on the activity metric (currently uptime percentage).
With the calendar view users can get a high level appreciation of a machine’s activity over a longer period of time.
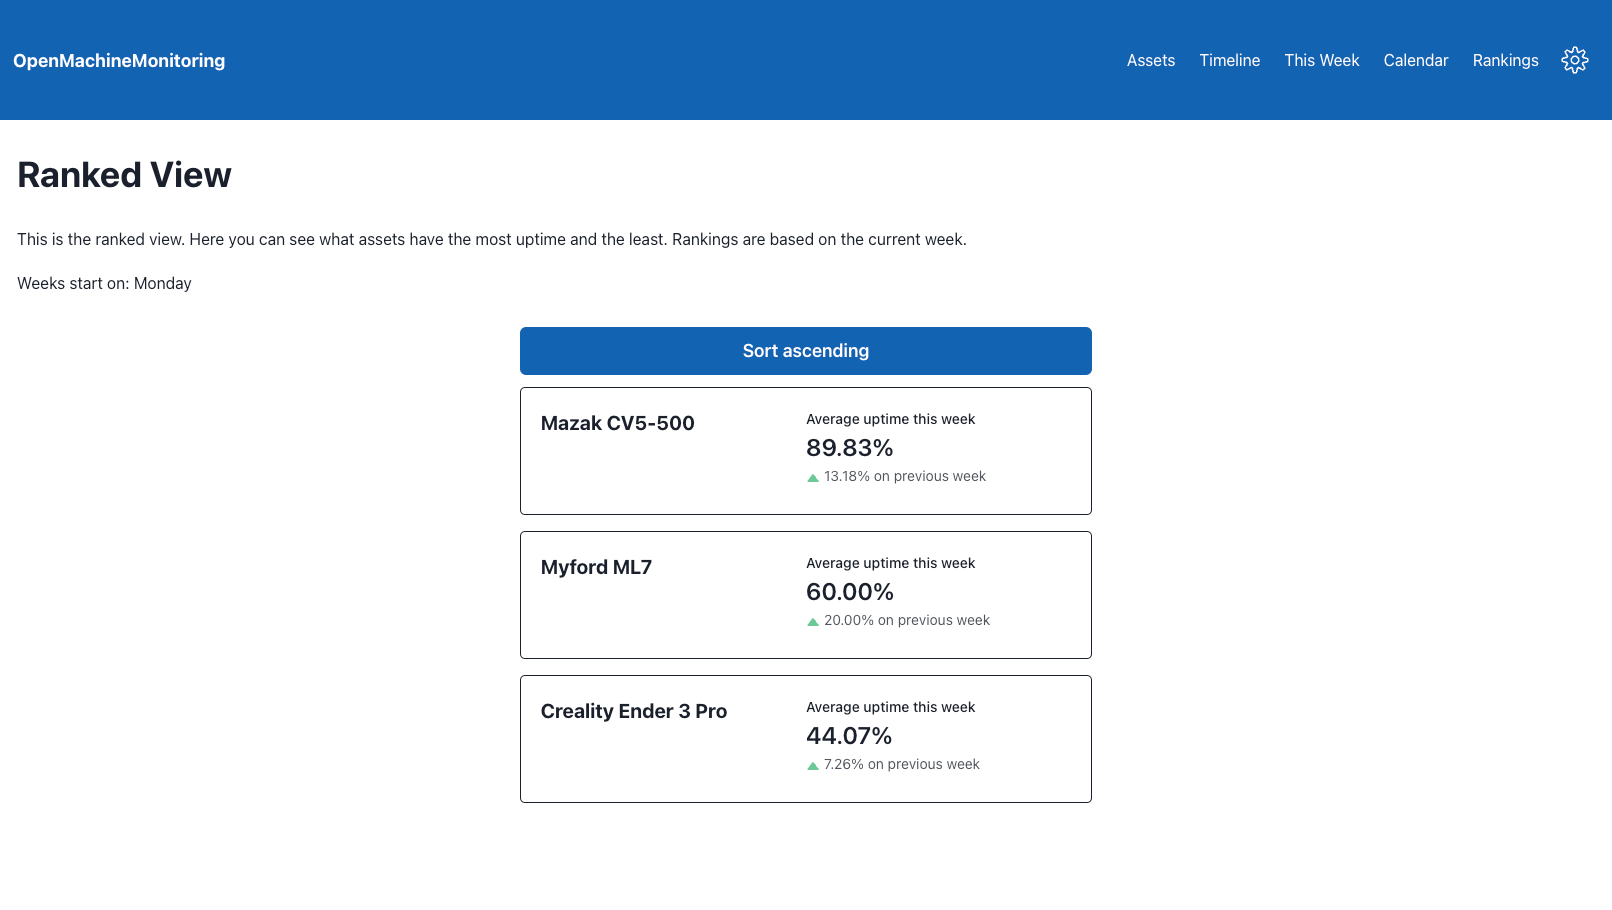
Ranked View
The ranked view shows an ordered list of all connected machines with the most “active” machines at the top (users can reorder the list so that the least active are at the top).
The ranked view is useful to quickly identify machines that are used a lot or machines that perhaps have spare capacity or some other issue that warrants further investigation.
Summary
The simple functionality of capturing electrical current usage and presenting this data to production managers not only has great potential value in itself, but it also represents a good first step towards wider digital transformation.
By removing barriers of cost and locked-down functionality, the open-source OpenMachineMonitoring project aims to empower as many SME manufacturers as possible to take this first step and so accelerate digital transformation within this sector of the manufacturing industry.
During this high-level tour we have examined the various components of the OpenMachineMonitoring tool:
Machine activity information is derived from the measured electrical current of each machine.
Data is packaged in a known format and piped to a database via an MQTT server and a Telegraf agent.
A backend written in Python can query the database, manage asset information and manage settings.
A frontend accessed through a web browser provides several views to the user so they can visualise and understand the activity of their machines.
Next
Subsequent posts will go into more detail for each constituent component of OpenMachineMonitoring.
Please feel free to reach out with comments, questions and all other feedback!
You can comment here or get in touch with me on LinkedIn, Twitter or Threads.